Which type of graph is made by \(y = x^2\)?
Quadratic graphs usually curve.
\(y = x^2\) is a quadratic graph. Its shape is a U-shaped curve called a parabola.
Quadratic graphs form curved shapes known as parabolas. Understanding their shape and key features helps link algebra with graphical interpretation.
A quadratic graph is a curved graph called a parabola.
It comes from an equation where the highest power of x is 2.
Unlike linear graphs, quadratic graphs are not straight lines. They curve upward or downward and often have a highest or lowest point.
A function with highest power \(x^2\).
The curved shape made by a quadratic graph.
The highest or lowest point on the graph.
The vertical line that cuts the parabola into two matching halves.
A point where the graph crosses the x-axis.
The point where the graph crosses the y-axis.
The lowest point on a parabola that opens upward.
The highest point on a parabola that opens downward.
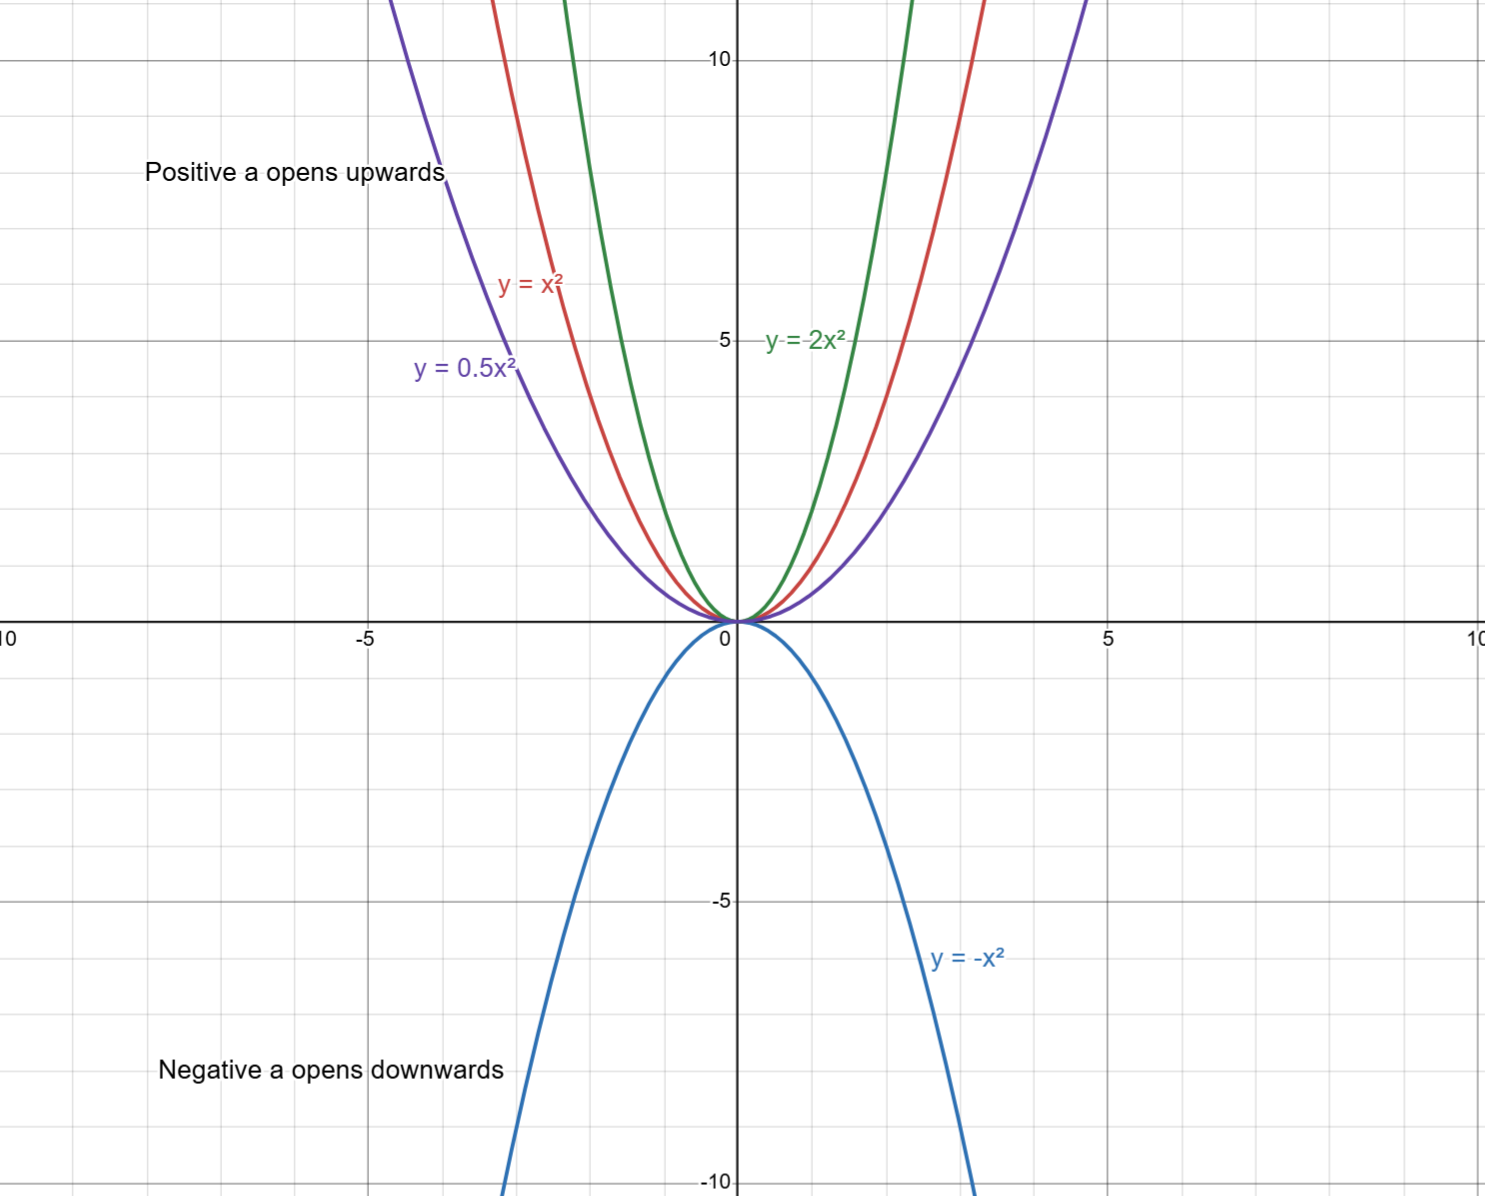
The parabola opens upward.
The parabola opens downward.
The parabola becomes narrower or steeper.
The parabola becomes wider.
A quadratic graph is a curved graph called a parabola. It is always symmetrical and has one turning point. These graphs come from quadratic equations.
Graph opens upwards (minimum point).
Graph opens downwards (maximum point).
Graph is narrow and steep.
Graph is wide.
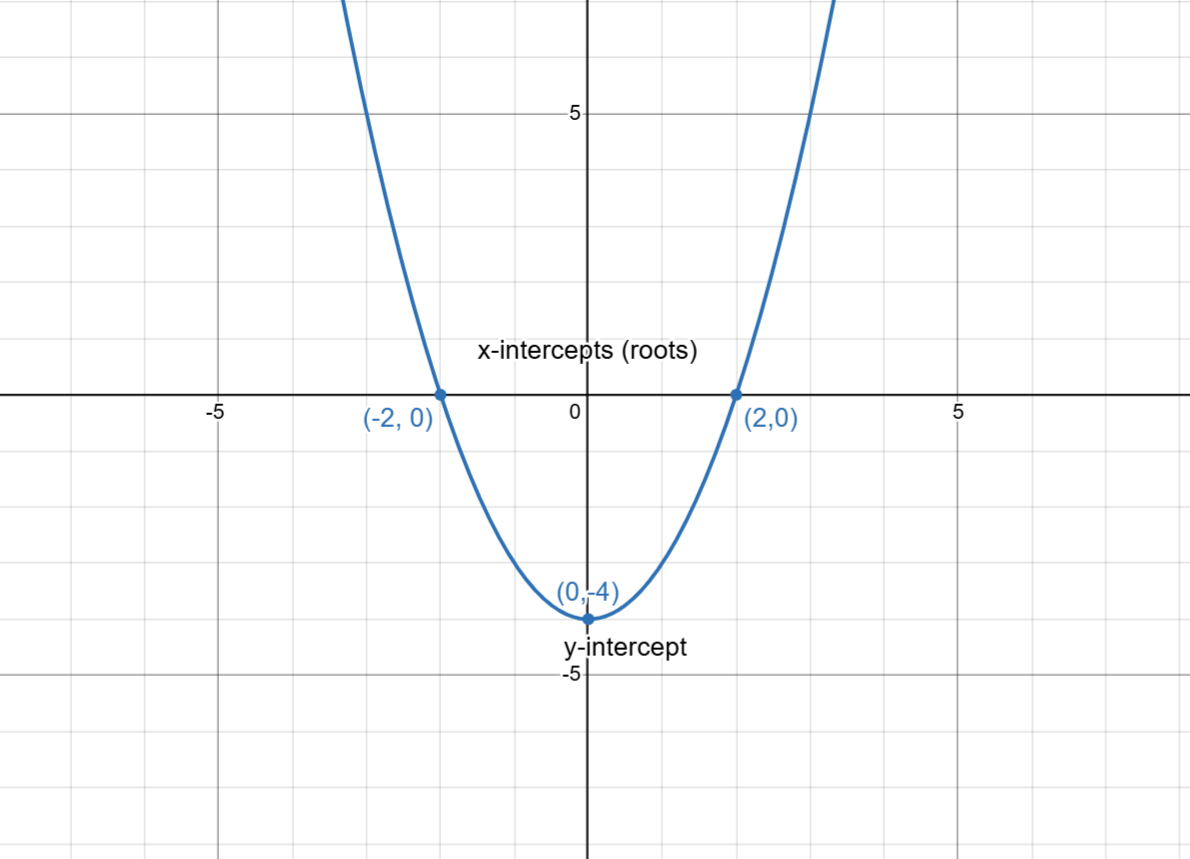
Intercepts help you sketch the graph quickly.
Set \(x = 0\). The value of \(c\) gives the point.
Solve \( ax^2 + bx + c = 0 \). These are where the graph crosses the x-axis. See solving quadratics.
Quadratic graphs are symmetrical about a vertical line called the axis of symmetry.
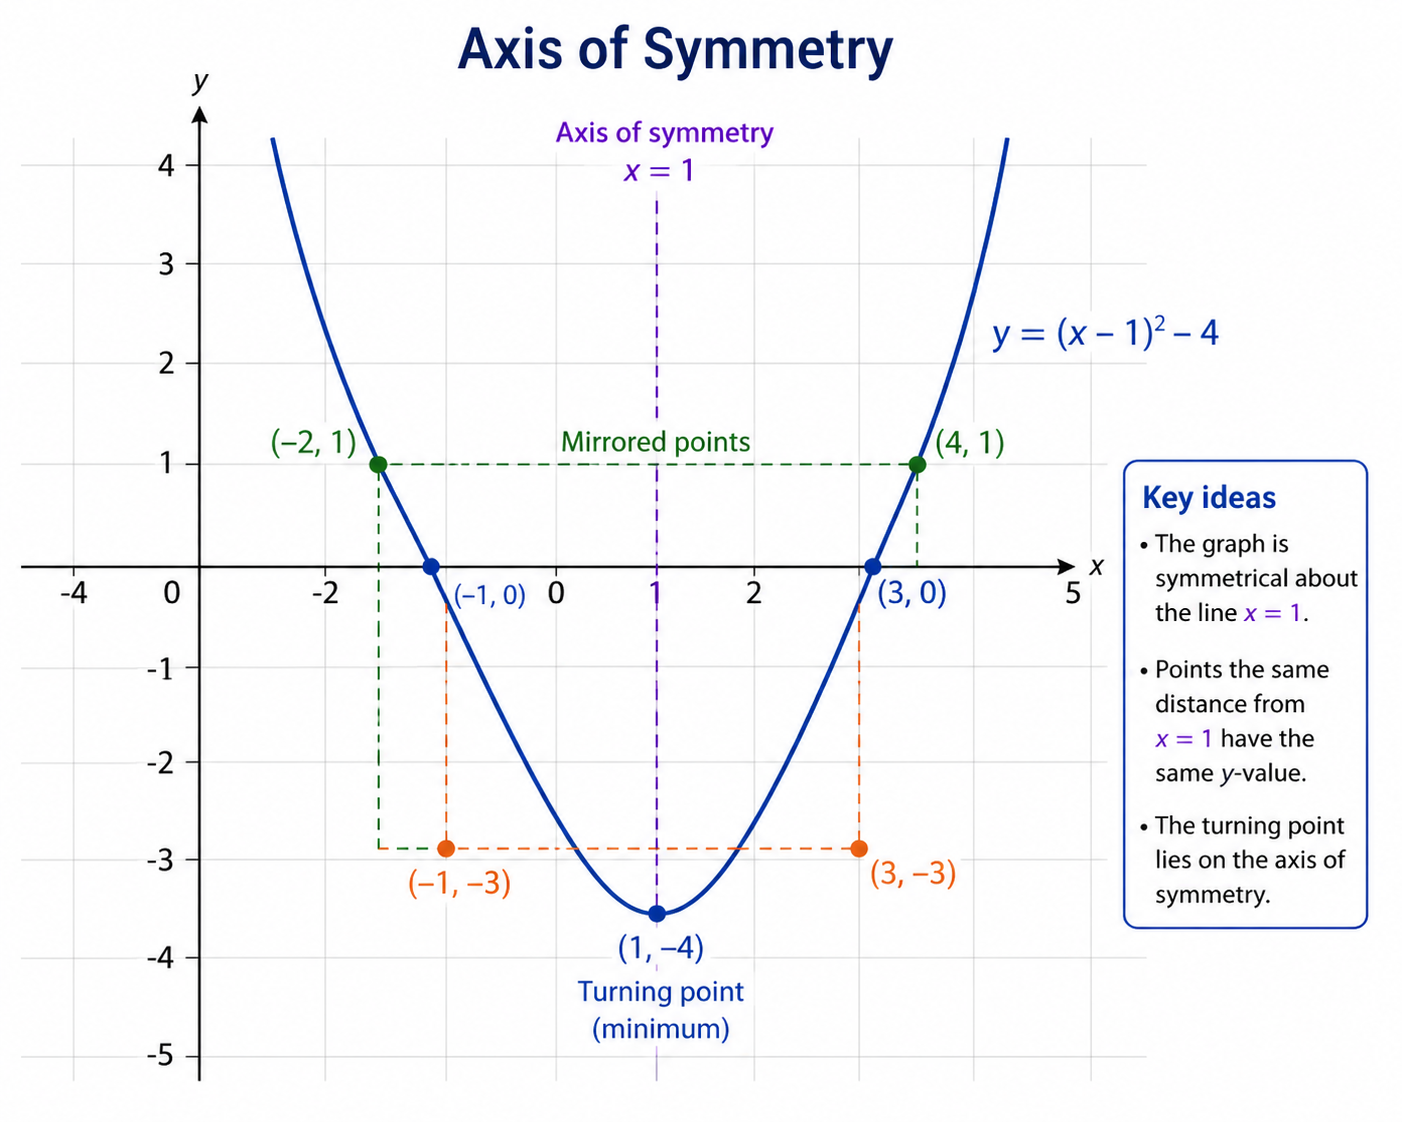
The turning point is the highest or lowest point of the graph.
Upward graph → minimum point.
Downward graph → maximum point.
Use key features instead of a full table. This builds on factorising expressions.
Graph crosses the x-axis twice.
Graph touches the x-axis once.
Graph does not meet the x-axis.
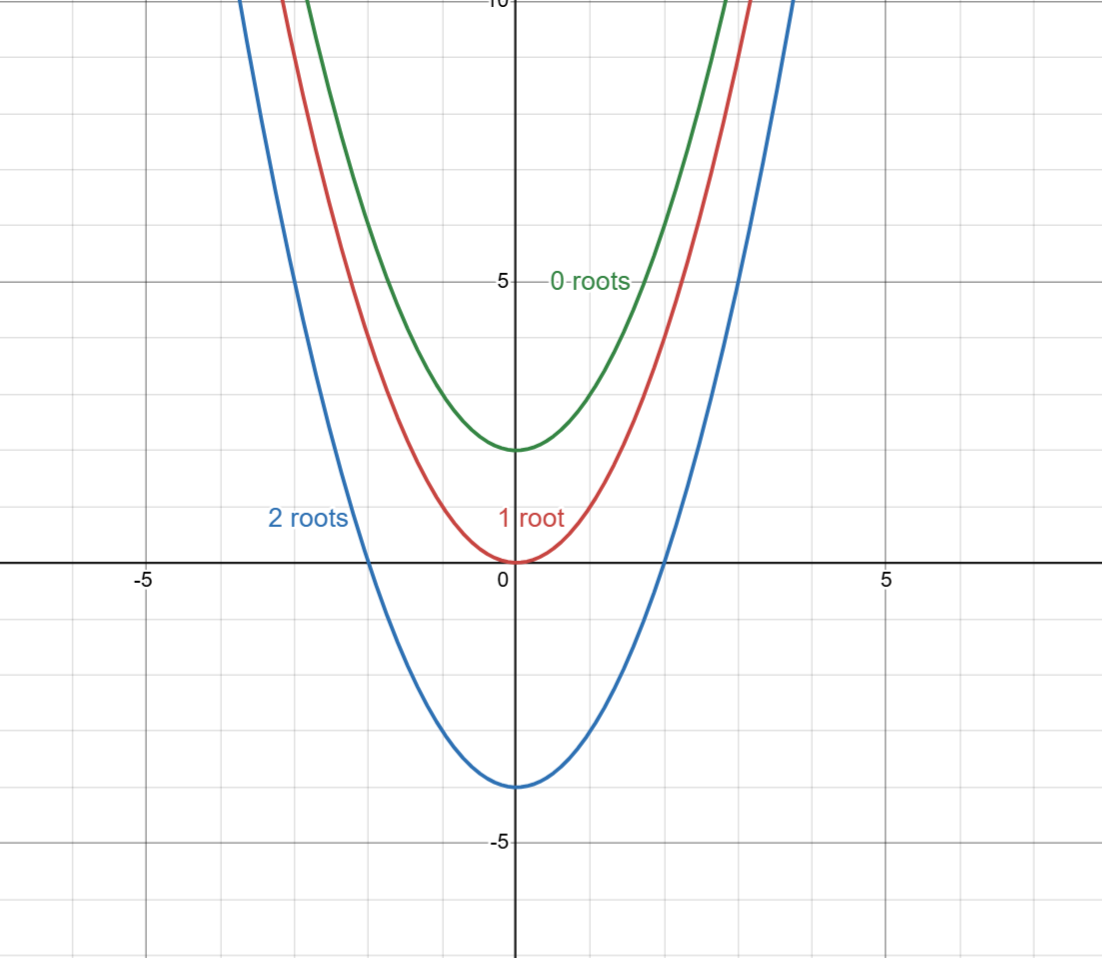
Solving a quadratic gives the x-intercepts of the graph.
Exam-style questions inspired by Edexcel GCSE Mathematics, focusing on plotting, interpreting, and analysing quadratic graphs.
Complete the table of values for \( y = x^2 \) when \( x = -2, -1, 0, 1, 2 \).
On a set of axes, plot the graph of \( y = x^2 - 4 \).
Write down the coordinates of the turning point of \( y = x^2 - 6x + 5 \).
Find the values of \( x \) where the graph of \( y = x^2 - 5x + 6 \) crosses the x-axis.
Write down the equation of the line of symmetry of \( y = x^2 - 8x + 7 \).
Exam-style questions based on the AQA GCSE Mathematics specification, focusing on interpreting quadratic graphs and solving equations graphically.
Sketch the graph of \( y = x^2 + 2x - 3 \).
Use the graph of \( y = x^2 - 3x - 4 \) to solve \( x^2 - 3x - 4 = 0 \).
State the coordinates of the turning point of \( y = (x - 2)^2 + 1 \).
The graph of \( y = x^2 \) is transformed to \( y = x^2 + 5 \). Describe the transformation.
A student says that the graph of \( y = x^2 + 4 \) crosses the x-axis.
Tick one box. True ☐ False ☐
Give a reason for your answer.
Exam-style questions aligned with OCR GCSE Mathematics, emphasising reasoning, transformations, and interpreting quadratic graphs.
The graph of \( y = x^2 \) is translated to \( y = (x - 3)^2 \). Describe this transformation.
Find the coordinates of the turning point of \( y = -x^2 + 4x - 1 \).
Determine the y-intercept of \( y = 2x^2 - 3x + 1 \).
Find the roots of \( 2x^2 - 7x + 3 = 0 \) from its graph.
The graphs of \( y = x^2 \) and \( y = x^2 - 4 \) are drawn on the same axes. State the coordinates of their points of intersection.
Check whether the graph should open upward or downward.
Find key points such as intercepts and the turning point if possible.
Use symmetry to help plot matching points.
Draw a smooth parabola, not straight line segments.
Forgetting that a quadratic graph is curved, not straight.
Not using the matching shape on both sides of the turning point.
Confusing roots with the y-intercept.
Using the wrong sign of \( a \) and drawing the parabola the wrong way.
These are common mistakes students make when working with graphs of quadratic functions in GCSE Maths.
A student joins points with straight lines.
Quadratic graphs are smooth curves (parabolas), not straight lines. Always draw a smooth curve through the points.
A student draws one side of the graph differently from the other.
Quadratic graphs are symmetrical about a vertical line through the turning point. Both sides should mirror each other.
A student labels intercepts incorrectly.
The y-intercept is where the graph crosses the y-axis (x = 0). The x-intercepts are where the graph crosses the x-axis (y = 0).
A student expects the graph to cross the x-axis twice.
A quadratic can have two roots, one root (touching the axis), or no real roots depending on the equation.
A student sketches the graph without identifying its highest or lowest point.
The turning point (vertex) is a key feature of the graph. Always identify and plot it when sketching.
Practise plotting and analysing quadratic graphs.
Recognise quadratic graphs, complete tables and identify simple features.
Which type of graph is made by \(y = x^2\)?
Complete the value: when \(x = 3\), find \(y\) for \(y = x^2\).
For \(y = x^2\), what is \(y\) when \(x = -4\)?
For \(y = x^2 + 1\), find \(y\) when \(x = 2\).
Which coordinate lies on the graph \(y = x^2\)?
For \(y = x^2 - 2\), find \(y\) when \(x = -3\).
The graph of \(y = x^2\) has its lowest point at which coordinate?
For \(y = x^2 + 3\), what is the y-intercept?
A student says \((-2)^2 = -4\). What mistake did they make?
For \(y = x^2 - x\), find \(y\) when \(x = 3\).
Analyse turning points, roots, intercepts and quadratic graph features.
For \(y = x^2 - 4\), where does the graph cross the y-axis?
Find the roots of \(y = x^2 - 9\). Give your answer as two x-values separated by a comma.
Which graph has a turning point at \((0, 5)\)?
For \(y = (x - 2)^2\), what is the turning point?
For \(y = -x^2 + 4\), what is the shape of the graph?
For \(y = x^2 - 4x + 3\), find the y-intercept.
Find the roots of \(y = x^2 - 5x + 6\).
For \(y = x^2 - 6x + 8\), find the roots. Give your answer as two x-values separated by a comma.
A student says the y-intercept of \(y = x^2 + 3x - 7\) is 3. What mistake did they make?
For \(y = (x + 3)^2 - 2\), what is the turning point?
Practise interpreting graphs of quadratic functions.
A parabola.
Points where the graph crosses the x-axis.
The highest or lowest point of the curve.